Climate Data: Where It Comes From and How to Read It
Temperature has been measured regularly in Germany since 1881, and the nationwide series of the German Weather Service reach back to that year. They make a good starting point for explaining what climate data is and why one chart can be read in different ways. Where do the numbers come from, and how can you judge what they really show? What follows covers data sources and rules for reading charts. Extra figures that could not be checked against publications of the weather services are left out.
Where Does Climate Data Come From?
Climate data comes mainly from measuring stations run by national weather services. In Germany this job belongs to the Deutscher Wetterdienst (DWD), based in Offenbach am Main. It publishes station data and yearly reports on the climate in Germany.
The data covers temperature, precipitation and hours of sunshine. Averages for the whole country are calculated from the readings of many stations. The result is a single series that lets you compare values over time. Such a series is much easier to analyze than hundreds of individual readings, although it hides regional differences.
Temperature Anomaly: What Does It Mean in a Chart?
Many charts do not show an absolute temperature but the temperature anomaly. This is the deviation from the average of a chosen reference period. A positive value means the year was warmer than that average, and a negative value means it was colder.
The display is useful because it makes years and stations with different conditions comparable. Keep in mind, however, that the anomaly depends on the reference period you pick. If it changes, the whole curve shifts in the chart even though the measured values stay the same. That is why it pays to check the reference period for every anomaly.
How Do You Read Climate Data Step by Step?
The first question concerns spatial scope: does the chart show data from one station, a whole country or the entire world? The trend at a single station can differ from the national average, and the national average need not match global results. The second question is about axis scaling. The same curve can look calm or dramatic depending on how far the vertical axis is stretched. The third question is the reference period mentioned above.
DWD reports show that Germany has warmed noticeably since measurements began. Exactly how much depends on the period considered and on the method of calculation, which is why figures in different publications do not always agree. That is not a mistake but a result of different assumptions.
Why Does Station Data Have to Be Homogenized?
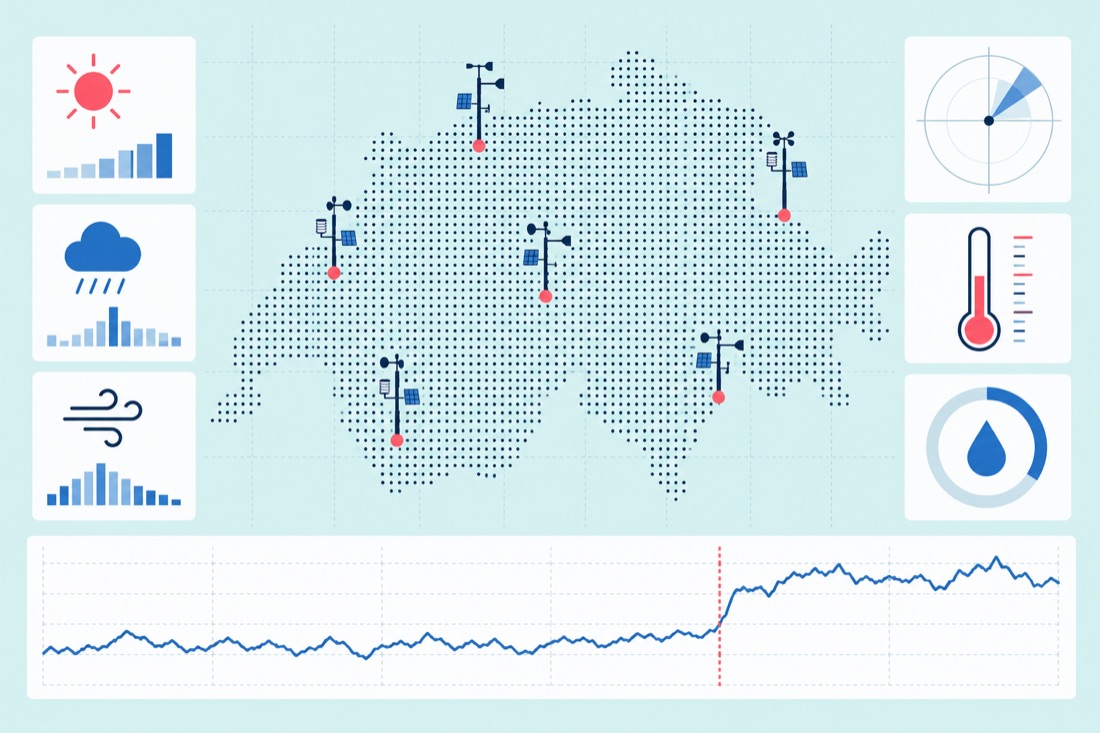
Over more than a hundred years, station locations and instruments have changed. Such changes can cause jumps in a measurement series that have nothing to do with the weather. That is why station data sometimes has to be homogenized, meaning corrected to remove the influence of technical changes. This step is part of careful handling of climate data and does not tamper with the results.
A few fixed habits therefore help with sober interpretation: check the source, the spatial scope, the axis scaling and the reference period. It is worth consulting the reports and data of the German Weather Service and reading the method description that goes with each chart.